The iPhone Was Not Yet the Ecosystem: Mechanism Audit,
Calibration, and Falsification Tests for Myers and Hooper
(2026)
[redacted for review]
June 2026
JEL codes: J13, O33, L86, D91
Keywords: fertility decline; iPhone; smartphones; feature phones;
texting; social media; contraception; mechanism validity
Abstract
Myers and Hooper (2026) use AT&T's 2007-2011 U.S. iPhone
exclusivity as a natural experiment and estimate large reductions in
birth rates in counties with high AT&T 3G coverage. This comment
accepts the usefulness of the reduced-form design but argues that the
mechanism interpretation is underidentified. The paper's
interaction-displacement channel was not smartphone-specific: ordinary
cell phones, SMS, multimedia feature phones, PC social networking,
mobile browsers, BlackBerry, Android, and Wi-Fi Apple devices already
supported mediated teen interaction before a mature iPhone app ecosystem
existed. This revised version adds three formal robustness modules: a
first-stage calibration showing the treatment-on-treated magnitudes
implied by plausible iPhone-adoption first stages; a dated ecosystem
timeline that imposes a conception-to-birth lag on candidate mechanisms;
and a mechanism-by-data matrix that specifies the public and restricted
evidence needed to distinguish iPhone apps from SMS, PC social
networking, contraception, pregnancy resolution, STI exposure, and local
recession/urban trends. Existing public evidence favors a narrower
interpretation: AT&T 3G coverage likely proxies a broader
early-digital, urban, socioeconomic, and reproductive-control bundle.
The iPhone may have been part of that bundle, but the public mechanism
evidence does not yet support attributing one-third to one-half of the
national fertility decline to an iPhone-specific behavioral
mechanism.
1. Introduction
Myers and Hooper (2026) ask whether the iPhone functioned as a
fertility-reducing technology. The empirical design exploits a
historically useful fact: from June 2007 until the Verizon iPhone launch
in February 2011, U.S. iPhone service was tied to AT&T. Counties
with high AT&T 3G coverage therefore had better access to the iPhone
during the first diffusion wave. The paper estimates birth-rate
reductions of 4.5-8.0% among women aged 15-19 and 3.2-6.6% among women
aged 20-24, and attributes 33-52% of the 2007-2011 decline in the
general fertility rate to iPhone diffusion (Myers and Hooper 2026).
The design is creative. The weakness is not the institutional fact of
the AT&T monopoly. The weakness is the interpretation of the
treatment. The paper's empirical treatment is AT&T 3G coverage. Its
title and decomposition are about the iPhone. Its mechanism story is
broader still: reduced in-person social interaction, more pornography,
lower sexual frequency, and possibly changes in reproductive
information. Those are not the same object. A technology can be
plausibly associated with all of these behaviors without the empirical
design identifying that particular mechanism.
This comment extends the earlier calibration critique by auditing the
mechanisms one by one. The aim is not to prove that phones cannot affect
fertility. They can. The aim is to ask which phone-mediated mechanisms
were actually available at scale from 2007 to 2011, which were specific
to the iPhone, and which should leave observable traces outside county
birth rates. The core finding is that the iPhone-specific mechanism
burden is too heavy. The social-displacement mechanism existed, but it
existed primarily through ordinary phones, SMS, PC social networking,
BlackBerry, Android, mobile browsers, and Wi-Fi devices. The dating-app
and modern image-feed channels mostly did not exist. The contraception
channel has strong independent support but is not iPhone-specific.
Pornography remains weakly measured as an iPhone mechanism.
The comment is structured as a mechanism audit. Section 2 sets up the
causal chain and the falsification logic. Sections 3 through 10 examine
social interaction, SMS and feature phones, mobile social networking,
the app stack, dating apps, pornography, contraception, and outcome
triangulation. Section 11 sets out specific tests that can be run using
the original county panel and additional data. Section 12 concludes.
The reduced-form estimate can be written as an effect of AT&T 3G
coverage on birth rates. The mechanism interpretation requires a longer
chain:
AT&T 3G coverage caused materially higher iPhone adoption
among the relevant women, partners, and peer groups.
The marginal iPhone exposure changed a behavior that is
fertility-relevant.
The behavior changed births rather than only reallocating births
across ages or places.
The effect was large enough relative to the first stage to
explain a substantial share of national fertility decline.
Competing channels correlated with AT&T coverage - feature
phones, SMS, PC social networks, Android/BlackBerry, iPods, broadband,
recession exposure, contraception, and media campaigns - do not explain
the same patterns.
Each link implies different evidence. A social-displacement mechanism
should predict reduced in-person interaction where iPhone exposure
rises, after the relevant device and app timing. A
contraception-information mechanism should predict reduced pregnancies
and unintended births, possibly without a large decline in sexual
activity. A pornography-substitution mechanism should predict lower
partnered sex and perhaps lower STIs, but it requires device-specific
evidence because online pornography was already available on PCs. A
dating-app mechanism should not affect births until the apps exist and
diffuse. A general digital-modernity channel should appear on non-iPhone
platforms and Wi-Fi devices as well.
The target paper's mechanism evidence is weaker than its reduced-form
evidence. The authors use national survey series and Google Trends to
document broad declines in time with friends, some changes in sexual
behavior, and rising pornography interest. Those series are useful
background facts, but they are not linked to AT&T coverage at the
county-year level. The paper is therefore vulnerable to mechanism
slippage: a county-level AT&T treatment is used to support a
national behavioral narrative that may have been driven by different
technologies or non-technological changes.
Table 1. Mechanism audit
summary
| In-person social displacement |
Time with friends and partnered sex should fall in AT&T/iPhone
counties. |
National time-with-friends declines exist, but SMS and online
networks were already mass-adopted. |
High: mechanism applies to dumb phones, SMS, PC internet,
BlackBerry/Android, and iPod touch. |
Plausible but not iPhone-identified. |
| Feature-phone/SMS displacement |
Texting intensity should predict fertility if mediated interaction
reduces in-person contact. |
75% of teens owned cell phones in 2009; 72% of all teens texted; 54%
texted daily. |
Direct: this is the closest pre-existing substitute for the proposed
channel. |
Must be controlled or falsified. |
| Mobile social media |
Mobile Facebook/social use should rise in treated places and predict
births. |
72.2 million U.S. mobile users accessed social networking/blogs in
Aug. 2011; this included smartphone and non-smartphone users. |
High: social media was not iPhone-only and was already
PC-based. |
Plausible general digital channel. |
| Native apps and notifications |
Effects should begin only after App Store/push/iMessage timing plus
gestation. |
App Store July 2008 with 500 apps; push in 2009; iMessage Oct.
2011. |
Medium-high: app ecosystem was early and cross-device. |
Timing must be mechanism-specific. |
| Dating apps |
Effects should appear after Tinder/Hinge mobile launch plus
gestation. |
Tinder launched in 2012; Hinge mobile in 2013; Pew found 5% of ages
18-24 used dating apps in 2013. |
Very high: post-treatment for 2007-2011 births. |
Cannot explain core-window births. |
| Pornography substitution |
Mobile porn should rise in AT&T/iPhone counties and sexual
frequency/STIs should fall. |
Target paper uses national Google Trends/GSS; no county-device first
stage. |
High: online pornography was not iPhone-specific. |
Unidentified without platform/carrier data. |
| Contraception/reproductive information |
Pregnancies and unintended births should fall; contraception use
should rise; sex need not fall. |
Contraceptive use at last sex among 15-19 rose 78% to 88% in
2007-2014; sexual activity did not change. |
High as rival, not necessarily as refutation. |
Strong alternative mechanism. |
| Pregnancy resolution |
Abortions should move differently from births if pregnancy
resolution changes. |
CDC abortion measures decreased during 2007-2011. |
Medium: falling births and abortions fit fewer pregnancies, not
merely more abortion. |
Requires pregnancies/abortions by geography. |
3. Social
displacement: plausible, but not iPhone-specific
The social-displacement channel is the most intuitive mechanism in
Myers and Hooper (2026): the iPhone may have absorbed attention,
substituted mediated interaction for in-person time, and reduced
opportunities for partnered sex. The paper's own national time-use
evidence is consistent with a broad decline in time spent with friends.
But a valid mechanism test must ask whether the marginal technology
causing that displacement was the iPhone or a broader communication
environment.
The existing evidence makes this distinction central. Pew reported
that in 2009, 75% of U.S. teenagers aged 12-17 owned cell phones, 72% of
all teens texted, and 54% texted daily (Lenhart 2010). Daily texting had
risen rapidly from 38% in February 2008 to 54% in September 2009. Among
teen texters, one-third sent more than 100 texts per day. This is
already a high-frequency mediated-interaction environment before the
mature app ecosystem. If texting reduces in-person contact, then
ordinary cell phones are a first-order treatment.
This is not a minor control variable. For teenagers, SMS was closer
to universal than the iPhone. The paper's estimated effects are
especially large at ages 15-19, precisely the group for which early
iPhone ownership was likely most limited relative to ordinary cell
ownership. Pew later reported that teen smartphone ownership was only
23% in the 2011 teen survey, while cell-phone ownership was 77% (Lenhart
2012). Thus, the social-displacement mechanism was available to far more
teenagers through non-smartphones than through iPhones.
The mechanism is also behaviorally direct. Texting is not merely a
generic media channel. It coordinates meeting, flirting, conflict,
avoidance, parental monitoring, and romantic negotiation. Pew's
online-dating report later found that among adults with recent dating
experience, 37% had asked someone out by text message on a cell phone
and 17% had broken up with someone by text message, email, or online
message (Smith and Duggan 2013). Those figures are later than the
AT&T monopoly window and include adults, but they show that SMS
itself is a relationship technology. The relevant treatment could be
mediated communication, not smartphone ownership.
The falsification implication is straightforward. A paper claiming an
iPhone-specific social-displacement mechanism should show that the
treatment effect survives controls for local feature-phone/SMS intensity
and that SMS-heavy non-iPhone places do not exhibit comparable fertility
declines. If that test fails, the mechanism becomes a general
mobile-communication story. That would still be interesting, but it
would not support the decomposition attributing one-third to one-half of
the national fertility decline to iPhone diffusion.
4.
PC social networking and dumb-phone interaction were already mature
enough to affect teens
A second reason the mechanism is not iPhone-specific is that social
networking was already widespread on PCs and mobile browsers. Pew
reported that 73% of online American teens used social-networking
websites as of September 2009, compared with 55% in November 2006 and
65% in February 2008 (Pew Research Center 2010a). Online young adults
were also heavy users. Thus the social graph existed before the modern
smartphone-app environment.
This timing matters. If digital social life reduced in-person
interaction, that process did not begin with the native App Store. It
plausibly began with broadband, MySpace, Facebook, instant messaging,
SMS, and camera phones. The iPhone improved mobility and interface
quality, but it did not introduce the basic social-network mechanism. In
an econometric design, the question is whether AT&T 3G coverage
generated an incremental social shock large enough to produce the
estimated fertility effects after accounting for the pre-existing PC/SMS
social layer.
The iPod touch is an underused placebo for this claim. Apple
introduced the iPod touch in September 2007 with Wi-Fi, Safari, YouTube,
and the iPhone-style interface, but without an AT&T cellular
contract (Apple 2007b). Apple reported App Store downloads jointly for
iPhone and iPod touch users in 2008, and iPhone OS 3.0 served more than
30 million iPhone and iPod touch users worldwide by March 2009 (Apple
2008b; Apple 2009a). If apps, mobile web, YouTube, games, and portable
screens are the mechanism, Wi-Fi Apple devices should matter even when
AT&T cellular coverage does not. If only AT&T iPhone coverage
matters, the paper needs to explain why cellular iPhone ownership,
rather than the broader Apple mobile-media ecosystem, is the operative
treatment.
This is not a semantic objection. The iPod touch and Wi-Fi devices
break the link between AT&T coverage and Apple mobile-app exposure.
The iPhone itself bundles three components: a phone, a mobile internet
device, and an app/media platform. AT&T exclusivity identifies the
cellular phone component most clearly. The paper's mechanism, however,
often refers to the app/media/social components. A credible mechanism
test should use iPod touch, home broadband, Wi-Fi density, and PC
social-network penetration as placebo or competing treatments.
5.
App ecosystem timing: the treatment window precedes much of the modern
mechanism
The ecosystem-maturity critique becomes sharper when the birth lag is
imposed. A birth observed in year t generally reflects conception
roughly nine months earlier. Therefore, a mechanism must exist and
diffuse before the relevant conception window, not merely before the
birth year. A 2011 birth usually reflects 2010 or early-2011 behavior. A
late-2011 app or service cannot explain most 2011 births.
The original iPhone went on sale in June 2007, but it did not have a
native third-party App Store (Apple 2007a). The App Store launched in
July 2008 with 500 apps (Apple 2018). Apple reported more than 10
million downloads in the first weekend, with apps ranging from games to
location-based social networking, medical applications, and productivity
tools, and later reported 100 million downloads by September 2008 (Apple
2008b; Apple 2008c). Push notifications appeared with iPhone OS 3.0 in
2009, when the App Store had more than 25,000 apps (Apple 2009a). Apple
announced 100,000 apps in November 2009 (Apple 2009b). iMessage,
Notification Center, and deep Twitter integration came with iOS 5 in
2011, at the end of the AT&T exclusivity window (Apple 2011a; Apple
2011c).
These dates imply a set of timing restrictions. Effects in 2007 and
much of 2008 cannot be attributed to native apps. Effects in 2009 can be
attributed to early apps, games, maps, mobile web, and Facebook mobile,
but not to iMessage, Tinder, Snapchat Stories, Instagram Direct, or
algorithmic feeds. Effects in 2010-2011 can include early Instagram only
at the end of the period; they still cannot include Tinder or most
modern social-app features.
Table
2. Ecosystem timing and earliest plausible birth effects
| Original iPhone |
June 2007 |
Mobile web, SMS, camera, better browser; no native App Store. |
Some births in 2008, but not app-driven. |
| iPod touch |
Sept. 2007 |
Apple mobile web/media/App Store placebo without AT&T cellular
service. |
Some births in 2008 via Wi-Fi/media only. |
| iPhone 3G and App Store |
July 2008 |
3G/GPS/native apps; Apple says 500 launch apps. |
Mainly 2009 births onward. |
| Push notifications / OS 3.0 |
2009 |
Stronger app habit loops; 25,000 apps by March 2009. |
Late 2009 and 2010 births onward. |
| Instagram launch |
Oct. 2010 |
Early image social network; initially small and iOS-only. |
Mid/late 2011 births at earliest, limited scale. |
| Verizon iPhone |
Feb. 2011 |
Breaks AT&T monopoly; key handoff test. |
Late 2011/2012 births onward. |
| iMessage / iOS 5 |
Oct. 2011 public release |
Rich iOS messaging and Notification Center. |
Mid-2012 births onward. |
| Tinder |
2012 |
Mobile dating/hookup channel. |
Mid-2013 births onward. |
| Instagram Direct / Snapchat Stories |
2013 |
Private image messaging and ephemeral story interaction. |
2014 births onward. |
Mobile social networking is a more plausible 2009-2011 mechanism than
dating apps. It existed and it scaled. Comscore reported that 72.2
million Americans accessed social networking sites or blogs on a mobile
device in August 2011, up 37% over the previous year; nearly 40 million
did so almost daily (Comscore 2011c). But this evidence does not
identify an iPhone channel. Comscore's mobile-social statistic covers
mobile devices broadly. It includes browser and app access, smartphone
and non-smartphone access, and multiple carriers.
The platform evidence also cuts against a uniquely iPhone
interpretation. In December 2010, Comscore reported 63.2 million U.S.
smartphone subscribers, with RIM at 31.6% of the smartphone platform
market, Android at 28.7%, and Apple at 25.0% (Comscore 2011a). By June
2011, Android had 40.1% and Apple 26.6% (Comscore 2011b). Nielsen's 2010
app report similarly showed that popular smartphone apps were games,
Facebook, Google Maps, and Weather Channel, with Facebook among the most
popular apps across iPhone, Android, and BlackBerry users (Nielsen
2010). The relevant app categories were not Apple-only.
If mobile social networking is the causal channel, the test should
not be AT&T iPhone coverage alone. It should compare iPhone,
Android, BlackBerry, feature-phone mobile web, and PC social networking.
The paper's Verizon/Sprint placebo tests are useful but not decisive
because non-AT&T carriers had different device mixes and customer
bases before 2011. The stronger test is a post-2011 handoff: after the
Verizon iPhone launch, Verizon-strong counties should display a delayed
fertility response if iPhone access is the causal technology (Apple
2011b). A further test is whether Android-heavy counties show similar
effects by 2010-2011. If they do, the paper should be retitled around
mobile internet rather than the iPhone. If they do not, the authors need
to explain why an app ecosystem with cross-platform Facebook, maps,
browsers, and games would produce an iPhone-only fertility effect.
7. Dating apps:
the cleanest timing falsification
The mobile dating-app mechanism is the clearest case where ecosystem
maturity falsifies the strongest interpretation. Tinder did not exist
during the AT&T-exclusive window. Tinder's press materials describe
a 2012 launch, and contemporaneous reporting in January 2013 described
Tinder as a newly launched iOS dating app gaining traction on campuses
(Tinder n.d.; Empson 2013). Hinge's own history states that Justin
McLeod created Hinge in 2012 and launched a mobile version in 2013
(Hinge n.d.).
Even after launch, mobile dating-app penetration was initially
modest. Pew's 2013 online-dating report found that 3% of all adults and
6% of smartphone owners had used a mobile dating app, with 5% of ages
18-24 and 11% of ages 25-34 reporting such use (Smith and Duggan 2013).
The report's app-specific counts, based on a small dating-app-user
subsample, included only one Tinder mention. These data are not precise
measures of Tinder adoption, but they strongly indicate that swipe
dating could not have driven births in 2007-2011.
The sign of the dating-app mechanism is also theoretically ambiguous.
A dating app can reduce search costs and increase partnered sex,
especially among adults, which could raise pregnancy risk absent
contraception. It can also replace in-person courtship with screening,
delay partnership, alter match quality, or increase contraception-aware
casual sex. Because the direction is ambiguous and timing is late,
dating apps should be treated as an out-of-window mechanism for this
paper. If the authors wish to claim dating-app-mediated fertility
effects, the appropriate outcome window is births from mid-2013 onward,
not the AT&T monopoly period.
The contemporary intuition that smartphones changed youth interaction
is often based on Instagram, Snapchat, Stories, direct image messaging,
algorithmic ranking, filters, and status-performance loops. Most of that
stack is outside the paper's treatment window. Instagram launched in
October 2010, meaning any effect on births within 2007-2011 would be
limited to conceptions after late 2010 and would require very rapid
adoption (Siegler 2010). Instagram Direct came in December 2013 (Crook
2013). Snapchat began as an early photo-messaging service in 2011 and
launched Stories in 2013 (Snap Inc. 2017; Rodriguez 2013).
Thus the app history does not support a modern social-media narrative
for 2007-2011 fertility declines. Early Instagram could contribute at
the margin for late-2011 births, but it was not yet the mature product
associated with algorithmic feeds, influencer culture, Stories, Direct
messaging, or Android scale. Snapchat Stories and Instagram Direct are
definitively post-window. A paper using 2007-2011 AT&T variation
should not rely implicitly on behavioral mechanisms that became salient
only after 2012.
A useful falsification is to estimate separate effects around the
launch and diffusion of these products. If image-social mechanisms
matter, later cohorts and later birth years should show event-study
breaks around 2011-2014, with platform-specific timing. If the estimated
fertility effect is already large before these products exist, then the
effect must be due to a different mechanism: ordinary phone
communication, mobile web, games, broader social networking,
contraception, recession-era postponement, or selection.
9.
Pornography: a possible mechanism with weak device-specific
evidence
The pornography mechanism is possible but currently weak as an iPhone
mechanism. Myers and Hooper (2026) use national evidence from Google
Trends and the General Social Survey to show rising pornography interest
and viewing. That evidence is consistent with increasing digital sexual
substitution. It does not show that AT&T 3G coverage caused a
county-level increase in mobile pornography use, nor that the increase
occurred specifically on iPhones.
The identification problem is larger than measurement. Online
pornography was widely accessible on PCs before the iPhone, and later
mobile access was available through multiple smartphones, feature-phone
browsers, Wi-Fi devices, and tablets. If pornography reduces partnered
sex, then broadband, private computer access, home Wi-Fi, non-iPhone
smartphones, and iPod touch/iPad access are all plausible channels. An
AT&T/iPhone design identifies the pornography mechanism only if
mobile porn consumption rose differentially in AT&T/iPhone counties
and if that rise predicts sexual behavior, pregnancies, and births.
The sign is also not mechanically guaranteed. Pornography may
substitute for partnered sex for some users. It may also complement
sexual interest, alter partner search, or have heterogeneous effects by
sex, age, relationship status, and baseline sexual activity. A mechanism
test therefore needs more than a national upward trend in pornography
search. It needs geography, platform, timing, and outcomes. The ideal
data would be county- or media-market-level adult-content traffic by
device class, operating system, and carrier; failing that, the authors
could use proxies such as Google Trends with media-market aggregation,
broadband exposure, smartphone-platform shares, and STI/pregnancy
outcomes. Without such evidence, pornography remains a speculative
behavioral channel.
The contraception channel is the strongest alternative explanation
because it directly predicts fewer births without requiring a large
decline in sexual activity. It is also supported by data from the exact
period. Lindberg, Santelli, and Desai (2016) find that improved
contraceptive use accounted for the entire decline in adolescent
pregnancy risk from 2007 to 2012, while sexual activity in the last
three months did not change significantly. The Guttmacher Institute
summary reports that improved contraception accounted for the entire 28%
decline in teen pregnancy risk during 2007-2012 (Guttmacher Institute
2016).
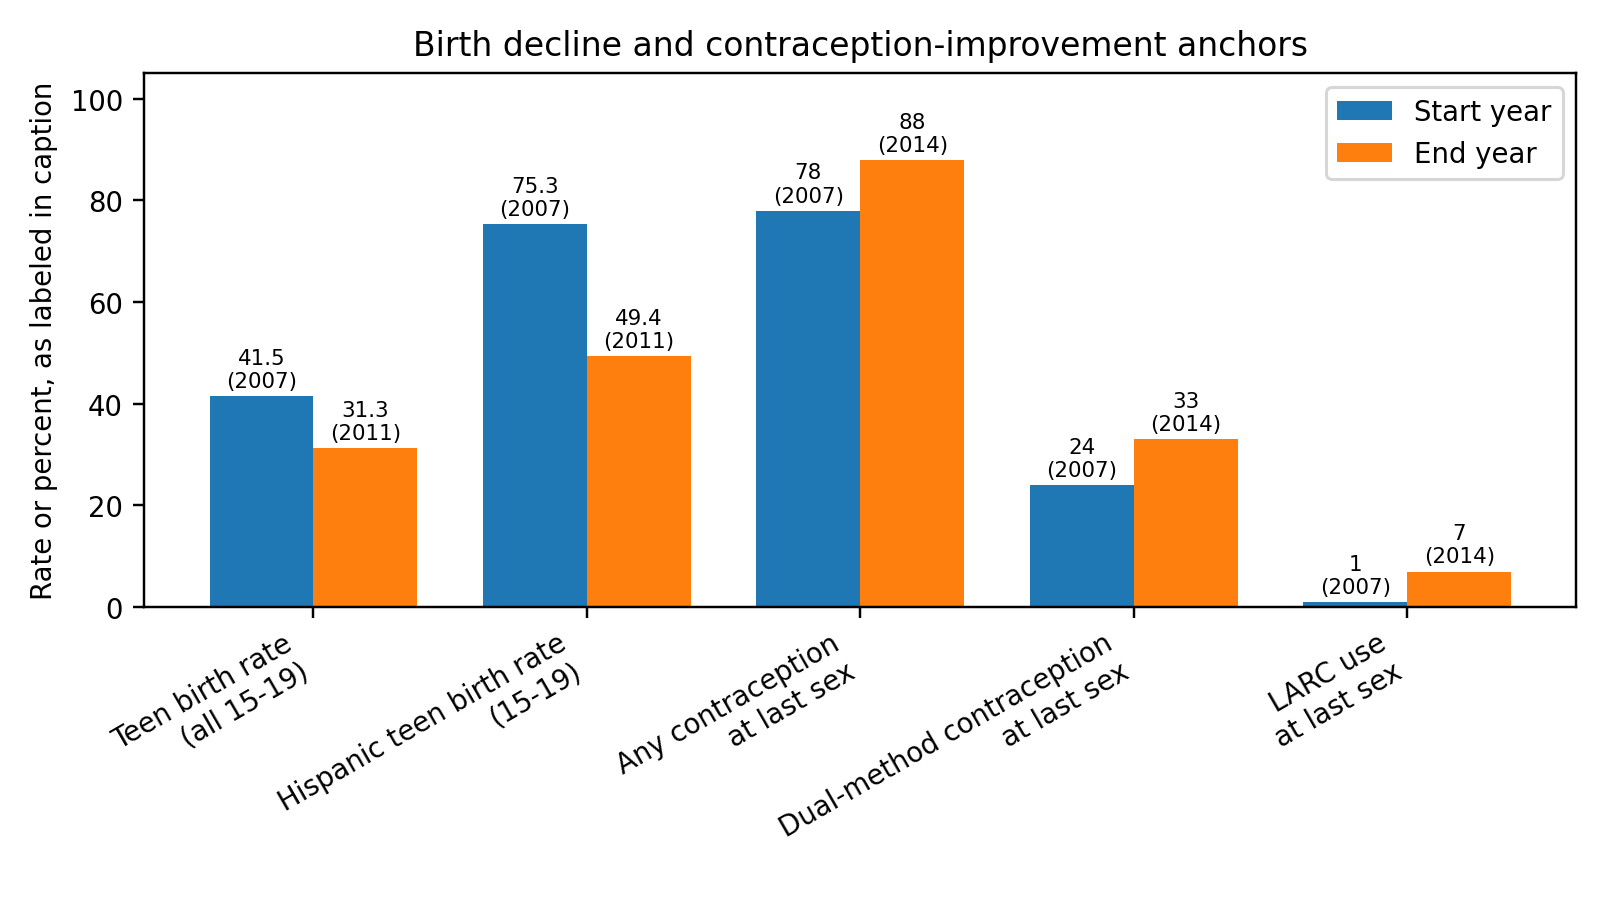
The later Journal of Adolescent Health update is equally important.
Lindberg, Santelli, and Desai (2018) report that among women aged 15-19,
use of one or more contraceptive methods at last sex rose from 78% to
88% between 2007 and 2014, dual-method use rose from 24% to 33%, and
long-acting reversible contraception rose from 1% to 7%. They also
report that the level of sexual activity did not change over time
(Lindberg, Santelli, and Desai 2018; Guttmacher Institute 2018).
This evidence is damaging to a simple social-displacement explanation
of teen births. If teen births fell because teenagers were much less
sexually active, one would expect a substantial decline in
contemporaneous sexual-activity measures. The CDC's YRBS also shows
little movement over the core window: 47.8% of high-school students had
ever had sexual intercourse and 35.0% were currently sexually active in
2007; in 2011 the corresponding figures were 47.4% and 33.7% (CDC 2008;
CDC 2012a). The decline in current sexual activity is too small, by
itself, to explain the large teen-birth decline.
A contraception-information mechanism could still involve phones.
Young people may have used mobile web, social media, SMS, or apps to
search for contraception, discuss pregnancy risk, coordinate clinic
visits, or receive media messages. But that mechanism is not
iPhone-specific. It operates through television, school, clinics, PC
internet, Google search, Facebook, texting, and non-iPhone mobile
devices. Kearney and Levine (2015) show that MTV's 16 and Pregnant
reduced teen births by 4.3% in the 18 months after its initial airing
and increased contraception/abortion information-seeking. That is the
same order of magnitude as the paper's teen iPhone estimate, and it is
explicitly a media/information mechanism rather than an iPhone
mechanism.
The proper empirical response is not to treat contraception as
background. It should be competed directly against the iPhone channel. A
county-year model should include local reproductive-health
infrastructure, Title X clinic access, Medicaid family-planning policy,
school sex education, LARC diffusion, uninsured rates, Planned
Parenthood presence, and media-market exposure to pregnancy-prevention
programming. If the iPhone coefficient shrinks or is concentrated where
contraception improved, the paper's interpretation changes: the iPhone
may be a proxy or amplifier for reproductive information rather than a
cause of reduced social interaction.
11.
Outcome triangulation: births alone cannot distinguish mechanisms
Birth rates are downstream of several processes: sexual activity,
contraception, fecundity, pregnancy intention, abortion, miscarriage,
partnership, migration, and timing of births. A birth-only outcome
cannot separate these channels. The mechanism tests should therefore
triangulate across pregnancies, abortions, STIs, sexual behavior, and
contraception.
The public aggregate evidence favors a pregnancy-prevention
interpretation over a pure reduction-in-sex interpretation. CDC reported
a 25% decline in the teen birth rate from 2007 to 2011, with especially
large declines among Hispanic teenagers (CDC 2012b). Over a similar
period, CDC abortion surveillance reports that from 2007 to 2011 the
number of reported abortions decreased by 26,058 per year and the
abortion rate decreased by 0.50 abortions per 1,000 women per year (CDC
2014). Falling births combined with falling abortions points toward
fewer pregnancies rather than merely a shift from births to abortions.
It does not by itself say whether fewer pregnancies came from less sex
or better contraception. The contraception literature points strongly
toward the latter for teenagers.
STI surveillance is a useful but imperfect falsification. If the
dominant mechanism were sharply reduced sexual contact, one might expect
reduced STI incidence among young people, all else equal. CDC's 2011 STD
surveillance does not show a clean broad decline: chlamydia reporting
reached 1,412,791 cases in 2011 with a rate of 457.6 per 100,000, while
CDC emphasizes that changes in screening, testing, and reporting affect
interpretation; gonorrhea rates declined over 2007-2011 but rose from
2010 to 2011 (CDC 2013). These data cannot falsify the paper on their
own because STI surveillance is affected by testing intensity and case
ascertainment. But they do show why births alone are too indirect. A
mechanism paper should report whether AT&T/iPhone exposure predicts
STIs, pregnancies, abortions, and contraceptive behavior in the same
places and cohorts.
The most informative pattern would be as follows. If iPhones reduce
in-person sex, treated counties should show lower sexual activity, fewer
pregnancies, fewer births, and probably lower STIs. If iPhones improve
contraception or reproductive planning, treated counties should show
fewer pregnancies and births but little necessary decline in sexual
activity or STIs. If iPhones alter pregnancy resolution, births and
abortions should move in opposite directions. If the estimated effect is
fertility postponement, younger-age births should fall while later-age
births rise. These patterns are distinguishable, but not from births
alone.
Table 3.
Mechanism-specific outcome predictions
| Reduced in-person sex |
Falls |
Ambiguous |
Falls |
Falls or unchanged |
Likely falls, testing caveats |
| Better contraception |
Unchanged or ambiguous |
Rises / more effective mix |
Falls |
Falls if fewer pregnancies |
Ambiguous |
| More abortion / changed resolution |
Ambiguous |
Ambiguous |
Ambiguous |
Rises relative to births |
Ambiguous |
| Fertility postponement |
Ambiguous |
Ambiguous |
Falls at young ages, may rise later |
Ambiguous |
Ambiguous |
| County trend/composition |
Depends on group |
Depends on local institutions |
Depends on composition |
Depends on access/reporting |
Depends on testing/reporting |
12.
First-stage calibration remains the decisive test
The mechanism audit reinforces the calibration problem. In May 2011,
Pew found that 35% of U.S. adults owned smartphones, with 49% ownership
among ages 18-24 and 58% among ages 25-34 (Smith 2011). Pew's 2011 teen
survey found that 23% of 12-17-year-olds had smartphones (Lenhart 2012).
Comscore reported that Apple had 25.0% of the U.S. smartphone platform
market in December 2010 (Comscore 2011a). A rough national teen iPhone
penetration estimate around 2011 is therefore in the mid-single digits,
although it was surely higher in affluent AT&T-covered places. Even
for young adults, iPhone penetration was far from universal.
This does not make an effect impossible. It means the paper must
report the implied treatment-on-treated effect. If the county-level
first-stage difference in actual iPhone exposure among 15-19-year-olds
is small, the implied direct fertility effect per marginal exposed user
is very large. That can be reconciled only with strong peer spillovers,
partner spillovers, or an interpretation in which AT&T coverage
proxies broader county digital maturity. Mechanism evidence is therefore
not ancillary. It is required for scale credibility.
The ideal first stage would measure iPhone adoption by county, year,
age, and sex. If that is unavailable, the authors could use AT&T
subscriber data, Apple activation data, Comscore/Nielsen/Scarborough
market data, mobile web user-agent logs, app-download geography, or
survey-based small-area estimates. The first-stage variable should be
actual exposure to the behaviorally relevant technology, not merely
network availability. The difference matters because many treated
counties may have AT&T coverage but low adoption among teens, while
many control counties may have high social-network/SMS exposure through
other devices.
13. Proposed
mechanism and falsification tests
The mechanism audit yields a concrete testing agenda. Some tests can
be run with the original birth panel and public data. Others require
restricted carrier, platform, or app data. The common principle is that
each mechanism must be tied to timing, platform, geography, and
intermediate outcomes.
13.1. Feature-phone and SMS
falsification
Add local measures of cell-phone ownership, SMS intensity,
QWERTY-phone penetration, youth texting, and pre-iPhone mobile
communication. The strongest available public evidence is national, but
commercial sources such as Nielsen, Comscore MobiLens, Scarborough, or
carrier billing aggregates may support media-market or county-level
proxies. If SMS intensity predicts fertility declines similarly to
AT&T iPhone exposure, the mechanism is mediated mobile communication
rather than the iPhone.
13.2. iPod touch,
Wi-Fi, and broadband placebo tests
Test whether Apple mobile-media exposure without AT&T cellular
service predicts similar fertility changes. The iPod touch had Wi-Fi,
Safari, YouTube, and the App Store, and Apple bundled iPhone and iPod
touch users in early App Store download reports (Apple 2007b; Apple
2008b). If app-mediated leisure, YouTube, games, and social browsing are
the channel, then Wi-Fi/broadband and iPod touch diffusion should
matter. If only AT&T iPhone coverage matters, the mechanism is
likely cellular availability, selection, or the specific social status
of the iPhone rather than apps per se.
Exploit the February 2011 Verizon iPhone launch and the rapid rise of
Android. If iPhone access is causal, Verizon-strong counties should
begin to exhibit a delayed fertility response after Verizon gets the
iPhone, with the appropriate conception-to-birth lag. If mobile
social/apps are causal, Android-heavy counties should show similar
effects by 2010-2011. If BlackBerry/Facebook/texting channels matter,
BlackBerry-heavy places should move as well. A null Verizon handoff or
strong Android/BlackBerry effect would weaken the paper's
iPhone-specific interpretation.
13.4. App-category timing tests
Estimate separate event-study breaks around the first iPhone, the
iPhone 3G/App Store, push notifications, Instagram, Verizon iPhone,
iMessage, Tinder, Instagram Direct, and Snapchat Stories. Mechanisms
cannot precede their own diffusion. Dating-app effects should begin
after 2012 plus gestation. Instagram Direct/Snapchat Stories effects
should begin after 2013 plus gestation. If the estimated fertility
response is already present before these product events, those
mechanisms should be removed from the narrative.
Run the same treatment design on intermediate outcomes: ATUS time
with friends, time alone, time on computer/mobile devices, NSFG sexual
frequency and contraception, YRBS sexual activity and contraception
proxies, STI rates, abortion rates, and pregnancy rates. The current
paper's national mechanism series are not enough. The correct question
is whether the AT&T/iPhone treatment predicts the intermediate
outcomes in the same county, age, sex, and year cells that drive the
birth effects.
13.6.
Race/ethnicity, nativity, and reproductive-health infrastructure
Decompose the estimates by race/ethnicity, nativity, age, marital
status, and education. The teen-birth decline was especially large among
Hispanic teenagers (CDC 2012b). If AT&T-treated counties experienced
differential Hispanic composition, immigration, labor-market exposure,
or access to reproductive-health services, the treatment may pick up
compositional and institutional trends. Interact the treatment with
Title X access, Medicaid family-planning waivers, LARC availability,
Planned Parenthood presence, school sex-education policy, insurance
coverage, and clinic density.
13.7. Fertility timing
and completed fertility
Separate postponement from completed fertility. A reduction in births
at ages 15-24 can be consistent with the same women having births later.
If AT&T/iPhone exposure primarily shifts births to older ages, the
paper is about timing, not necessarily lower completed fertility. Cohort
follow-up through later ages, or at least age-profile accounting, is
necessary before describing the effect as a large share of the national
fertility decline rather than a change in birth timing.
Table 4. Data
needed to adjudicate mechanisms
| County-year birth panel by age/race |
Yes, in vital statistics with access constraints for some
detail |
All |
Baseline outcome and heterogeneity. |
| County/media-market iPhone adoption |
Usually restricted/commercial |
First stage |
Needed for treatment-on-treated scale. |
| SMS/texting intensity by geography and age |
Commercial/carrier |
Feature-phone displacement |
If predictive, iPhone mechanism is contaminated. |
| Facebook/mobile social logins by device/carrier |
Platform restricted |
Mobile social |
Separates iPhone from cross-platform social use. |
| App-category downloads by geography |
Platform/commercial |
App stack |
Tests timing and category specificity. |
| Porn traffic by device/carrier/geography |
Industry restricted |
Pornography substitution |
Required for device-specific porn mechanism. |
| NSFG/YRBS sexual behavior and contraception |
Public microdata, limited geography |
Sex and contraception |
Distinguishes less sex from better contraception. |
| Abortion, pregnancy, STI data |
Public aggregate; detailed geography limited |
Outcome triangulation |
Distinguishes fewer pregnancies, changed resolution, and
reporting. |
| Title X/clinic/LARC/policy data |
Partly public |
Reproductive control |
Tests contraception/infrastructure rival channel. |
14.
Empirical implementation: calibration, timing, and public-data
tests
The critique above becomes more robust when its implications are
turned into executable tests. This section adds four implementation
components. First, a first-stage calibration table converts the paper's
reduced-form birth effects into implied treatment-on-treated magnitudes
under alternative assumptions about actual iPhone exposure. Second, a
timeline figure imposes a nine-month conception-to-birth lag on product
and app events. Third, a mechanism-test matrix states what would support
or weaken each behavioral channel. Fourth, a public-data roadmap
identifies auditable datasets that can be used to implement or
approximate the tests.
14.1.
First-stage calibration: how large must the direct iPhone effect
be?
The target paper reports reduced-form birth-rate reductions of
4.5-8.0% for ages 15-19 and 3.2-6.6% for ages 20-24. Those effects are
population effects. If the actual treatment is individual or peer-group
iPhone exposure, the implied direct effect among marginally exposed
users depends on the first-stage increase in exposure. The table below
does not estimate the first stage; it shows the arithmetic burden placed
on the mechanism. Under a no-spillover interpretation, the implied
treatment-on-treated effect equals the reduced-form percentage reduction
divided by the first-stage percentage-point increase in actual exposure.
Spillovers can reduce the direct-effect burden, but then the paper must
identify and measure those spillovers.
Table
5. Implied treatment-on-treated birth-rate reductions under alternative
iPhone first stages
| 5 pp |
90% |
160% |
64% |
132% |
| 10 pp |
45% |
80% |
32% |
66% |
| 15 pp |
30% |
53% |
21% |
44% |
| 20 pp |
22% |
40% |
16% |
33% |
| 30 pp |
15% |
27% |
11% |
22% |
Note: RF = reduced-form percentage reduction reported by Myers
and Hooper (2026). Entries equal RF divided by the assumed first-stage
exposure increase. The table is a calibration, not an estimate of actual
iPhone ownership. It highlights that small first stages imply very large
direct effects or large unmeasured spillovers.
The national adoption benchmarks illustrate why this table matters.
Pew reported that only 23% of U.S. teens aged 12-17 owned smartphones in
the 2011 teen survey, while Comscore reported that Apple accounted for
25.0% of U.S. smartphone subscribers in December 2010. Multiplying those
two national rates gives an approximate teen iPhone benchmark of 5.75%,
not a county first stage. In contrast, ordinary cell-phone and SMS
channels were already much larger: Pew reported 75% teen cell-phone
ownership, 72% of all teens texting, and 54% daily texting in 2009.
Figure 1 visualizes the scale contrast.
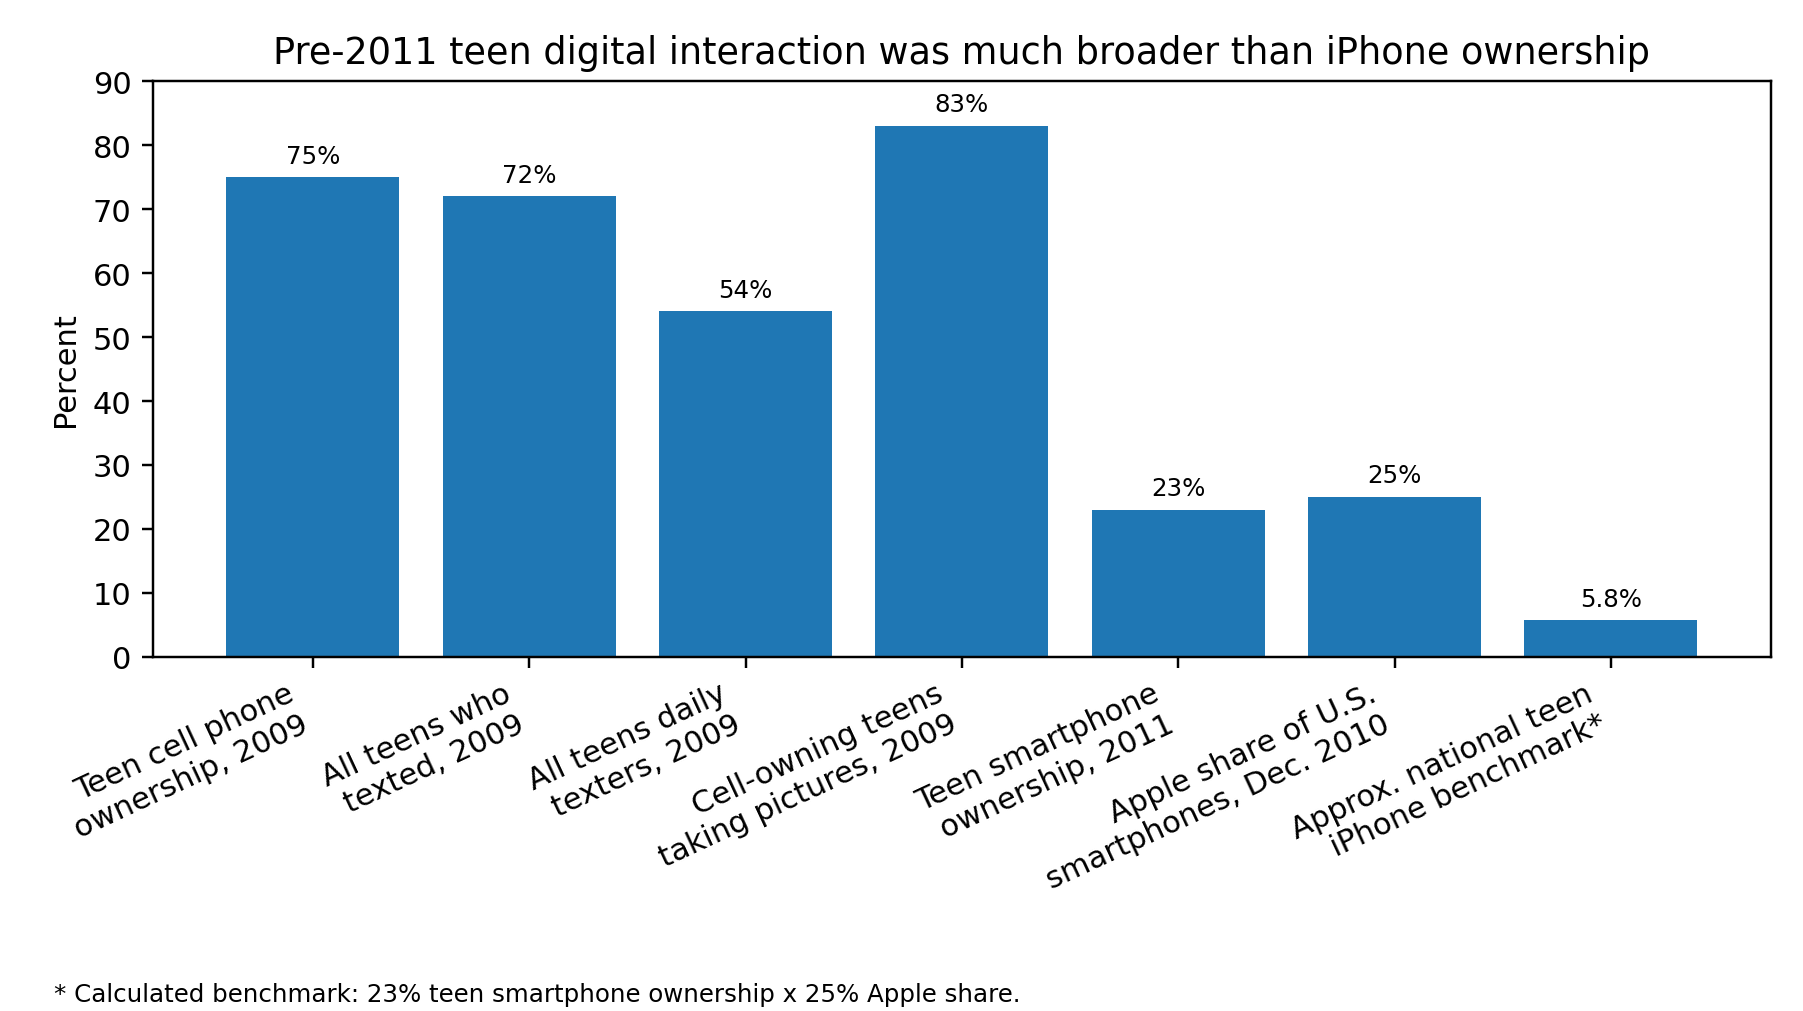
Figure 1. Teen digital interaction channels before 2011 compared
with smartphone/iPhone benchmarks. Sources: Pew teen mobile reports and
Comscore December 2010 smartphone-platform report. The final bar is a
calculated national benchmark, not a measured county treatment
effect.
14.2.
Timing discipline: mechanisms cannot precede their own app stack
The product-timing test is simple. A mechanism cannot cause a birth
outcome before the mechanism exists and before a conception-to-birth lag
has elapsed. The App Store did not open until July 2008 and launched
with 500 apps; Apple reported more than 3,000 apps in September 2008 and
over 100,000 apps in November 2009. iOS 5/iMessage was announced in June
2011 for fall availability. Tinder launched only after the
AT&T-exclusive window. Therefore, a modern app-social, iMessage,
swipe-dating, or ephemeral-image mechanism predicts birth effects no
earlier than its product date plus roughly nine months, and
realistically later once adoption diffusion is allowed.

Figure 2. Product timing and earliest plausible birth effects
under a nine-month conception-to-birth lag. The shaded region marks the
AT&T-exclusive iPhone window used by the target paper. Events are
dated from Apple, Tinder/Hinge/TechCrunch, Snap SEC, and contemporaneous
social-app sources.
14.3.
Mechanism-test matrix with pass/fail predictions
The central empirical improvement is to state, for each mechanism,
what evidence would support the iPhone-specific interpretation and what
evidence would move the estimate toward a broader digital-bundle or
reproductive-control interpretation. This avoids treating all mechanism
evidence as merely 'consistent with' the paper.
Table 6.
Mechanism-specific empirical predictions
| Feature-phone/SMS displacement |
High teen SMS or unlimited-texting exposure predicts lower births,
even without iPhone access. |
SMS measures absorb the AT&T effect or predict similar
declines. |
Pew teen texting; Nielsen/Comscore MobiLens; carrier/SMS plan data;
school phone-policy data. |
| PC/Facebook social networking |
Local PC broadband/Facebook/social-network exposure predicts births
before or independent of iPhone availability. |
Social-network/broadband controls attenuate the iPhone
treatment. |
Pew social-networking reports; NTIA broadband maps;
Facebook/platform or media-market data. |
| iPhone-native app ecosystem |
Effects begin after App Store/push/iOS milestones plus gestation and
track app-category diffusion. |
Effects begin before product milestones or appear in non-iPhone app
channels. |
Apple App Store timing; app-category downloads; iPod touch/Wi-Fi
placebos. |
| Dating apps |
No effect in 2007-2011; post-2012 effects in Tinder/Hinge/campus
diffusion windows. |
A pre-2012 dating-app narrative is used to explain AT&T-window
births. |
Tinder/Hinge launch data; Pew 2013 dating-app adoption;
campus/platform data. |
| Pornography substitution |
Treated counties show iPhone/mobile adult-content increases and
parallel declines in sex/STIs/pregnancies. |
Only national Google Trends/GSS series move, with no
device/geography first stage. |
Device-specific traffic logs; local search; NSFG/GSS; STI and
pregnancy outcomes. |
| Contraception/information |
Birth and pregnancy declines occur with stable sex/STI patterns and
improved contraceptive use. |
Sexual activity falls sharply while contraception does not
move. |
NSFG, YRBS, Title X, LARC/clinic data, Guttmacher/JAH evidence. |
| Pregnancy resolution/abortion |
Births fall because abortion ratios or abortion access change in
treated places. |
Pregnancies and abortions fall together, implying fewer pregnancies
rather than resolution shifts. |
CDC/Guttmacher abortion data; state abortion-policy and provider
data. |
| Local recession/urban trends |
Treatment remains after CBSA-year/media-market-year fixed effects,
race-by-age cells, and local shocks. |
Effects disappear under tight geography-year comparisons or
high-leverage metro exclusions. |
ACS, BLS LAUS, BEA county income, FHFA HPI, IRS migration, county
policy data. |
14.4. Public-data roadmap
Several of the proposed tests can be partially implemented with
public or restricted-public data. The strongest iPhone-first-stage and
app-category tests require commercial or platform data, but the birth,
STI, contraception, demographic, economic, housing, and broadband
robustness families are auditable and feasible. The table below
separates what can be done immediately from what requires restricted or
commercial access.
Table
7. Public and restricted-public data sources for implementing
falsification tests
| CDC WONDER Natality |
County/state by year; mother age/race where available; suppression
constraints |
Outcome and heterogeneity |
Re-estimate birth effects by age/race and conception-lag
timing. |
| CDC AtlasPlus / CDC STI surveillance |
State/county and demographic STI indicators where available |
Less-sex falsification |
Check whether treated places show consistent STI declines. |
| CDC YRBS |
National/state youth behavior surveys; limited county detail |
Sexual activity and contraception proxies |
Compare birth declines with sex/contraception trends. |
| NSFG public + RDC restricted geography |
Individual sexual behavior, contraception, fertility; restricted
residence geography via RDC |
Sex, contraception, pregnancy planning |
Merge digital exposure to state/county context under RDC
access. |
| ATUS |
Time use, socializing, time alone; limited geography |
Social displacement |
Test whether digital exposure predicts reduced in-person social
time. |
| ACS 5-year |
County social, economic, housing, demographic controls |
Selection/local trends |
Stress-test urban, education, race/ethnicity, income, and household
composition. |
| BLS LAUS |
County labor-force/unemployment annual series |
Great Recession/local shocks |
Control or interact unemployment shocks with treatment. |
| BEA county personal income |
County income and GDP/personal income series |
Economic confounding |
Measure local income shocks and recovery gradients. |
| FHFA HPI |
Metro/county/ZIP/tract housing-price indexes |
Housing-market fertility shocks |
Separate AT&T coverage from local housing bust/recovery. |
| NTIA National Broadband Map |
2010/2011 broadband availability, provider, speed, technology
records |
Broad digital adoption |
Compare AT&T treatment against fixed/mobile broadband and
non-iPhone connectivity. |
14.5.
What evidence would make the iPhone interpretation persuasive?
The iPhone-specific interpretation would become substantially more
credible if four conditions held jointly. First, AT&T 3G coverage
must strongly predict actual iPhone exposure among teens, young women,
partners, or peer groups, not merely average county technology
availability. Second, estimated birth effects must begin only after
relevant product events plus gestation: the July 2008 App Store for app
mechanisms, 2009 push notifications for notification-loop mechanisms,
late 2010/2011 Instagram for photo-social mechanisms, and post-2012 for
dating-app mechanisms. Third, feature-phone/SMS intensity, PC social
networking, BlackBerry/Android adoption, iPod touch/Wi-Fi exposure,
broadband, and local economic/reproductive-health trends must not
explain the same pattern. Fourth, intermediate outcomes must move in the
predicted direction: less in-person interaction and lower sexual
frequency for a social-displacement mechanism; lower pregnancies with
stable sex for a contraception-information mechanism; STI movements
consistent with a less-sex mechanism; and pregnancy/abortion patterns
that distinguish fewer conceptions from changed pregnancy
resolution.
This paragraph is intentionally symmetric. It identifies what
evidence would weaken this comment as well as what evidence would weaken
the target paper. A strong county-year first stage for actual iPhone
adoption, a clean Verizon handoff after February 2011, null effects for
SMS/broadband/iPod touch/Android/BlackBerry placebos, and
mechanism-consistent movements in pregnancies, STIs, sexual behavior,
and contraception would materially shift the balance toward Myers and
Hooper's interpretation.
15. Conclusion
The mechanism audit changes the interpretation of Myers and Hooper
(2026). The reduced-form AT&T 3G estimate may be real and important.
But the proposed behavioral explanation is not yet identified. The most
scalable mechanism during the treatment window - mediated teen
interaction - was already available through ordinary cell phones and
SMS. PC social networking was already widespread among teens. Mobile
social networking existed by 2011, but it was cross-platform and
included non-smartphone mobile access. The native app stack was still
forming. The modern dating-app and ephemeral image-social channels are
largely post-treatment. Pornography is plausible but not measured at the
required device/geography level. Contraceptive improvement is directly
supported by period-specific data and can explain falling births without
a large decline in sexual activity.
The most defensible version of the paper is therefore narrower than
its title: early mobile internet and broader digital connectedness may
have contributed to fertility postponement and pregnancy prevention in
counties at the frontier of digital adoption. That hypothesis is
plausible and worth testing. It is not the same as showing that the
iPhone itself caused one-third to one-half of the national fertility
decline.
A revised paper should explicitly separate four causal objects:
AT&T 3G coverage, iPhone ownership, smartphone/mobile internet use,
and the mature app-social ecosystem. It should then test mechanisms
against their own timing and platform predictions. Without those tests,
the iPhone remains a suggestive proxy for a broader bundle rather than a
demonstrated birth-control technology.
Data and code availability
This comment does not introduce a new restricted microdata analysis
and does not replicate Myers and Hooper's county-year estimates. It adds
transparent descriptive calibrations and source-audited mechanism
figures based on published aggregate values. The proposed falsification
tests require the original county-year fertility panel and, for the
strongest mechanism tests, carrier, platform, app, survey, commercial
media-market, or restricted geocoded health data. The calibration tables
in this draft are algebraic sensitivity checks, not substitute estimates
of the actual iPhone first stage.
Competing interests
The author declares no competing interests.
Source audit note
References include auditable URLs or DOI landing pages. Official
sources are used where possible: Apple Newsroom for product timing, Pew
for survey adoption and texting, Comscore/Nielsen for mobile-platform
and app-use context, CDC for births/abortions/STIs/YRBS, publisher or
PubMed pages for contraceptive-use papers, the AEA page for Kearney and
Levine, and the NBER/DOI page for the target paper. A separate mechanism
source-audit log accompanies this manuscript.
References
Apple. 2007a. 'iPhone Premieres This Friday Night at Apple Retail
Stores.' Apple Newsroom, June 28. Available at: https://www.apple.com/newsroom/2007/06/28iPhone-Premieres-This-Friday-Night-at-Apple-Retail-Stores/
Apple. 2007b. 'Apple Unveils iPod touch.' Apple Newsroom, September
5. Available at: https://www.apple.com/newsroom/2007/09/05Apple-Unveils-iPod-touch/
Apple. 2008a. 'AT&T and Apple to Launch iPhone 3G in the U.S. on
July 11.' Apple Newsroom, June 9. Available at: https://www.apple.com/newsroom/2008/06/09AT-T-and-Apple-to-Launch-iPhone-3G-in-the-US-on-July-11/
Apple. 2008b. 'iPhone App Store Downloads Top 10 Million in First
Weekend.' Apple Newsroom, July 14. Available at: https://www.apple.com/newsroom/2008/07/14iPhone-App-Store-Downloads-Top-10-Million-in-First-Weekend/
Apple. 2008c. 'App Store Downloads Top 100 Million Worldwide.' Apple
Newsroom, September 9. Available at: https://www.apple.com/newsroom/2008/09/09App-Store-Downloads-Top-100-Million-Worldwide/
Apple. 2009a. 'Apple Previews Developer Beta of iPhone OS 3.0.' Apple
Newsroom, March 17. Available at: https://www.apple.com/newsroom/2009/03/17Apple-Previews-Developer-Beta-of-iPhone-OS-3-0/
Apple. 2009b. 'Apple Announces Over 100,000 Apps Now Available on the
App Store.' Apple Newsroom, November 4. Available at: https://www.apple.com/newsroom/2009/11/04Apple-Announces-Over-100-000-Apps-Now-Available-on-the-App-Store/
Apple. 2011a. 'New Version of iOS Includes Notification Center,
iMessage, Newsstand, Twitter Integration Among 200 New Features.' Apple
Newsroom, June 6. Available at: https://www.apple.com/newsroom/2011/06/06New-Version-of-iOS-Includes-Notification-Center-iMessage-Newsstand-Twitter-Integration-Among-200-New-Features/
Apple. 2011b. 'Verizon Wireless & Apple Team Up to Deliver iPhone
4 on Verizon.' Apple Newsroom, January 11. Available at: https://www.apple.com/newsroom/2011/01/11Verizon-Wireless-Apple-Team-Up-to-Deliver-iPhone-4-on-Verizon/
Apple. 2011c. 'Apple Launches iPhone 4S, iOS 5 & iCloud.' Apple
Newsroom, October 4. Available at: https://www.apple.com/newsroom/2011/10/04Apple-Launches-iPhone-4S-iOS-5-iCloud/
Apple. 2018. 'The App Store Turns 10.' Apple Newsroom, July 5.
Available at: https://www.apple.com/newsroom/2018/07/app-store-turns-10/
Buckles, Kasey, Melanie Guldi, and Lucie Schmidt. 2025. 'The Great
Recession's Baby-Less Recovery: The Role of Unintended Births.' Journal
of Human Resources 60(1): 224-258. Available at: https://doi.org/10.3368/jhr.1220-11395R3;
https://ideas.repec.org/a/uwp/jhriss/v60y2025i1p224-258.html
CDC. 2012a. 'Youth Risk Behavior Surveillance - United States, 2011.'
MMWR Surveillance Summaries 61(SS-4): 1-162. Available at: https://www.cdc.gov/mmwr/preview/mmwrhtml/ss6104a1.htm;
https://pubmed.ncbi.nlm.nih.gov/22673000/
CDC. 2012b. 'Birth Rates for Females Aged 15-19 Years, by
Race/Ethnicity - National Vital Statistics System, United States, 2007
and 2011.' MMWR 61(42): 865. Available at: https://www.cdc.gov/mmwr/preview/mmwrhtml/mm6142a8.htm
CDC. 2013. Sexually Transmitted Disease Surveillance 2011. Atlanta:
U.S. Department of Health and Human Services. Available at: https://www.cdc.gov/sti-statistics/media/pdfs/2024/07/Surv2011.pdf
CDC. 2014. 'Abortion Surveillance - United States, 2011.' MMWR
Surveillance Summaries 63(SS-11): 1-41. Available at: https://www.cdc.gov/mmwr/preview/mmwrhtml/ss6311a1.htm;
https://pubmed.ncbi.nlm.nih.gov/25426741/
CDC. 2008. 'Youth Risk Behavior Surveillance - United States, 2007.'
MMWR Surveillance Summaries 57(SS-4): 1-131. Available at: https://www.cdc.gov/mmwr/preview/mmwrhtml/ss5704a1.htm;
https://pubmed.ncbi.nlm.nih.gov/18528314/
Comscore. 2011a. 'Comscore Reports December 2010 U.S. Mobile
Subscriber Market Share.' February 7. Available at: https://www.comscore.com/Insights/Press-Releases/2011/2/comScore-Reports-December-2010-US-Mobile-Subscriber-Market-Share
Comscore. 2011b. 'Comscore Reports June 2011 U.S. Mobile Subscriber
Market Share.' August 4. Available at: https://www.comscore.com/Insights/Press-Releases/2011/8/comScore-Reports-June-2011-US-Mobile-Subscriber-Market-Share
Comscore. 2011c. 'Social Networking On-The-Go: U.S. Mobile Social
Media Audience Grows 37 Percent in the Past Year.' October 20. Available
at: https://ir.comscore.com/news-releases/news-release-details/social-networking-go-us-mobile-social-media-audience-grows-37
Comscore. 2011d. 'Digital Omnivores: How Tablets, Smartphones and
Connected Devices are Changing U.S. Digital Media Consumption Habits.'
October 10. Available at: https://www.comscore.com/Insights/Presentations-and-Whitepapers/2011/Digital-Omnivores
Crook, Jordan. 2013. 'Instagram Introduces Instagram Direct.'
TechCrunch, December 12. Available at: https://techcrunch.com/2013/12/12/instagram-messaging/
Empson, Rip. 2013. 'Tinder: Finding Traction On Campuses, IAC's New
Dating App Makes It Easy To Break The Ice.' TechCrunch, January 3.
Available at: https://techcrunch.com/2013/01/03/tinder-finding-traction-on-campuses-hatch-labs-new-dating-app-makes-it-easy-to-break-the-ice/
Guttmacher Institute. 2016. 'Declines in Teen Pregnancy Risk Entirely
Driven by Improved Contraceptive Use.' News release, August 30.
Available at: https://www.guttmacher.org/news-release/2016/declines-teen-pregnancy-risk-entirely-driven-improved-contraceptive-use
Guttmacher Institute. 2018. 'Improvements in Contraceptive Use
Continue to Drive Declines in Pregnancy Among U.S. Adolescents.' News
release, August 30. Available at: https://www.guttmacher.org/news-release/2018/improvements-contraceptive-use-continue-drive-declines-pregnancy-among-us
Hinge. n.d. 'Our Story.' Hinge official website. Accessed June 9,
2026. Available at: https://hinge.co/our-story
Kearney, Melissa S., and Phillip B. Levine. 2015. 'Media Influences
on Social Outcomes: The Impact of MTV's 16 and Pregnant on Teen
Childbearing.' American Economic Review 105(12): 3597-3632. Available
at: https://doi.org/10.1257/aer.20140012;
https://www.aeaweb.org/articles?id=10.1257/aer.20140012
Lenhart, Amanda. 2010. 'Teens and Mobile Phones.' Pew Research
Center, April 20. Available at: https://www.pewresearch.org/internet/2010/04/20/teens-and-mobile-phones/
Lenhart, Amanda. 2012. 'Teens, Smartphones & Texting.' Pew
Research Center, March 19. Available at: https://www.pewresearch.org/internet/2012/03/19/teens-smartphones-texting/
Lindberg, Laura D., John S. Santelli, and Sheila Desai. 2016.
'Understanding the Decline in Adolescent Fertility in the United States,
2007-2012.' Journal of Adolescent Health 59(5): 577-583. Available at:
https://doi.org/10.1016/j.jadohealth.2016.06.024;
https://www.jahonline.org/article/S1054-139X(16)30172-0/fulltext
Lindberg, Laura D., John S. Santelli, and Sheila Desai. 2018.
'Changing Patterns of Contraceptive Use and the Decline in Rates of
Pregnancy and Birth Among U.S. Adolescents, 2007-2014.' Journal of
Adolescent Health 63(2): 253-256. Available at: https://doi.org/10.1016/j.jadohealth.2018.05.017;
https://pubmed.ncbi.nlm.nih.gov/30149926/
Myers, Caitlin K., and Ezekiel Hooper. 2026. 'Is the iPhone Birth
Control? Causal Evidence from AT&T's 2007-2011 Carrier Monopoly.'
NBER Working Paper No. 35310. Available at: https://doi.org/10.3386/w35310;
https://www.nber.org/papers/w35310;
https://www.nber.org/system/files/working_papers/w35310/w35310.pdf
Nielsen. 2010. 'The State of Mobile Apps.' Nielsen, June 2010.
Available at: https://www.nielsen.com/insights/2010/the-state-of-mobile-apps-2/
Pew Research Center. 2010a. 'Social Media and Young Adults.' February
3. Available at: https://www.pewresearch.org/internet/2010/02/03/social-media-and-young-adults/;
https://www.pewresearch.org/internet/2010/02/03/part-3-social-media/
Pew Research Center. 2010b. 'Part 2: Gadget Ownership and Wireless
Connectivity.' February 3. Available at: https://www.pewresearch.org/internet/2010/02/03/part-2-gadget-ownership-and-wireless-connectivity/
Rodriguez, Salvador. 2013. 'Snapchat Launches Stories Feature.' Los
Angeles Times, October 3. Available at: https://www.latimes.com/business/technology/la-fi-tn-snapchat-stories-feature-20131003-story.html
Siegler, MG. 2010. 'Instagram Launches with the Hope of Igniting
Communication Through Images.' TechCrunch, October 6. Available at: https://techcrunch.com/2010/10/06/instagram-launch/
Smith, Aaron. 2011. 'Smartphone Adoption and Usage.' Pew Research
Center, July 11. Available at: https://www.pewresearch.org/internet/2011/07/11/smartphone-adoption-and-usage/
Smith, Aaron, and Maeve Duggan. 2013. 'Online Dating &
Relationships.' Pew Research Center, October 21. Available at: https://www.pewresearch.org/internet/2013/10/21/online-dating-relationships-3/;
https://www.pewresearch.org/internet/2013/10/21/part-2-dating-apps-and-online-dating-sites/;
https://www.pewresearch.org/wp-content/uploads/sites/9/media/Files/Reports/2013/PIP_Online-Dating-2013.pdf
Snap Inc. 2017. Registration Statement on Form S-1. U.S. Securities
and Exchange Commission, February 2. Available at: https://www.sec.gov/Archives/edgar/data/1564408/000119312517029199/d270216ds1.htm
Tinder. n.d. 'About Tinder.' Tinder Press Room. Accessed June 9,
2026. Available at: https://www.tinderpressroom.com/about
Additional public-data documentation for robustness
modules:
BLS. n.d. 'American Time Use Survey.' U.S. Bureau of Labor
Statistics. Accessed June 9, 2026. Available at: https://www.bls.gov/tus/
BLS. n.d. 'Local Area Unemployment Statistics: Tables and Maps.' U.S.
Bureau of Labor Statistics. Accessed June 9, 2026. Available at: https://www.bls.gov/lau/tables.htm
CDC. n.d. 'Natality Information.' CDC WONDER. Accessed June 9, 2026.
Available at: https://wonder.cdc.gov/natality.html
CDC. n.d. 'About AtlasPlus.' National Center for HIV, Viral
Hepatitis, STD, and TB Prevention. Accessed June 9, 2026. Available at:
https://www.cdc.gov/nchhstp/about/atlasplus.html
CDC. n.d. 'National Survey of Family Growth.' National Center for
Health Statistics. Accessed June 9, 2026. Available at: https://www.cdc.gov/nchs/nsfg/index.htm
CDC. n.d. 'Restricted Data: National Survey of Family Growth.'
Research Data Center. Accessed June 9, 2026. Available at: https://www.cdc.gov/rdc/b1datatype/Dt1226.htm
CDC. n.d. 'Youth Risk Behavior Surveillance System.' Accessed June 9,
2026. Available at: https://www.cdc.gov/yrbs/index.html
Federal Housing Finance Agency. n.d. 'FHFA House Price Index.'
Accessed June 9, 2026. Available at: https://www.fhfa.gov/data/hpi
NTIA. n.d. 'June 30, 2010 National Broadband Map Datasets.' State
Broadband Initiative archive. Accessed June 9, 2026. Available at: https://www2.ntia.gov/June-2010-datasets
NTIA. n.d. 'June 30, 2011 National Broadband Map Datasets.' State
Broadband Initiative archive. Accessed June 9, 2026. Available at: https://www2.ntia.gov/Jun-2011-datasets
U.S. Bureau of Economic Analysis. n.d. 'Personal Income by County.'
Accessed June 9, 2026. Available at: https://www.bea.gov/data/income-saving/personal-income-by-county
U.S. Census Bureau. n.d. 'American Community Survey 5-Year Data
(2009-2024).' Accessed June 9, 2026. Available at: https://www.census.gov/data/developers/data-sets/acs-5year.html